A recent customer gave me a chance to exercise Tableau features, on both the Server and Desktop.
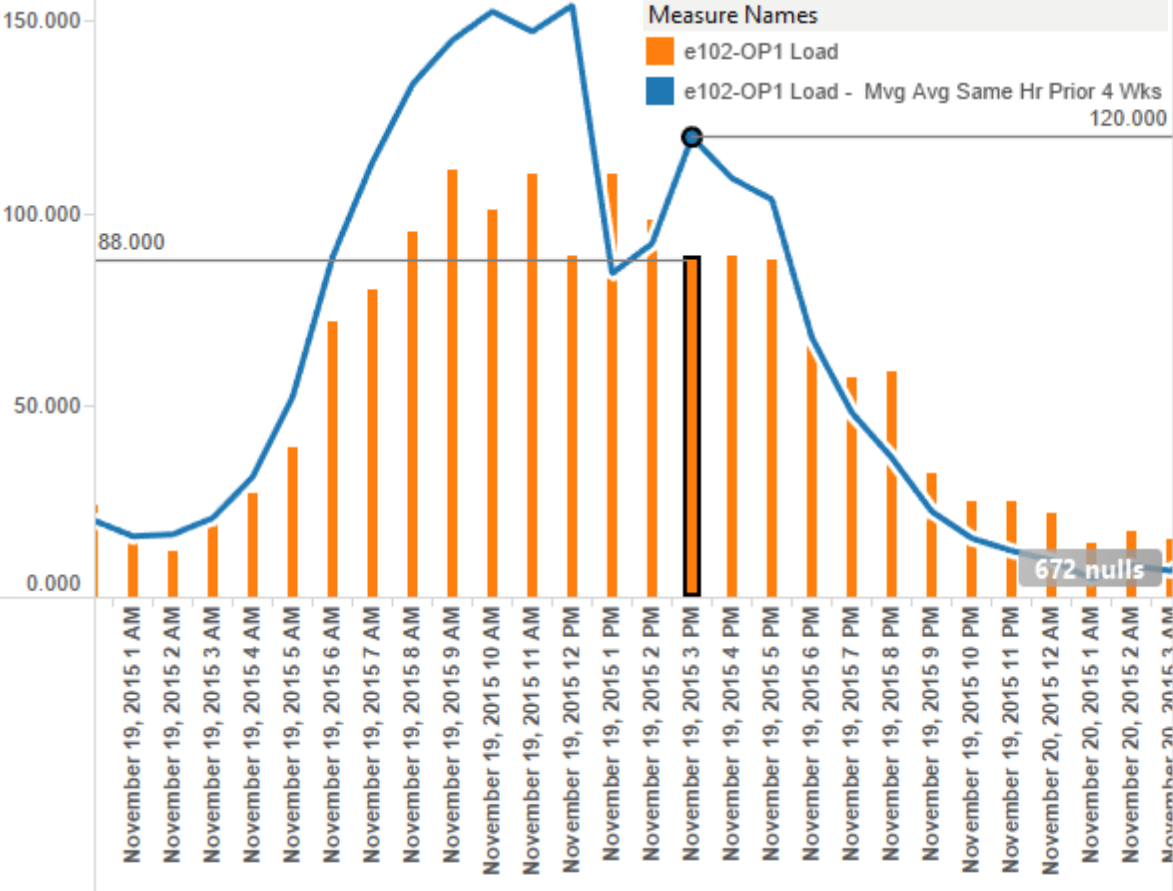
Although this write-up is focussed more on calculation than visualization, it also demonstrates my approach to visualizing complex data with a simple, impossible to misunderstand, presentation. My customer wanted visualizations that would bring simplicity to a rather complex calculation. The combination of value-labeled drop lines set to ‘on hover’ pointing left-vs-right across the sync’d dual-axes, and simple colors makes the end-user’s job of answering the following question effortless: “How did upsells do today, hour by hour (orange bars), in relation to our benchmark 4-week moving average for those same hours of the day? (blue line)
The Approach to the Underlying Calculation:
Because the source data was not transformed sufficiently to directly surface crucial data, I used Tableau to perform a series of calculations. As a move towards standardizing this process, I elected to write basic table calculations, validate them for accuracy in a cross-tabular display, and then build more targeted calcs on top of the basic ones, a reliable approach that Tableau’s calculation feature set supports well and which helps to eliminate duplicative sets of ‘soup-to-nuts’ calculations. If a building-block calc is wrong, I want to be able to fix it once, not fourteen times.
The calculation required that a current hourly value (up-sells from free to paid service) be compared (visually, of course) with a moving average of its corresponding values at that same hour, each week for the prior 4 weeks. The screenshot above shows the end result.
Without going into the calc-trivia, I accomplished it with ‘belt-and-suspenders’ using Table Calculations, one portion at a time in a large grid, so I could cross-check everything for accuracy like people often do it in Excel. Because I used table calculations, time-intelligence, and the aforementioned calcs-on-calcs, it was completed in one caffeine-fueled evening. Once validating the full-blown table- calc result in the grid, I then dragged each little stepping-stone calc back to the right-side metadata window and named it. In Tableau, this does two things: First, dragging back and naming it essentially promoted it as full-fledged metadata for the workbook, rather than just being a creation just in one worksheet. Before I get to the second effect, I’ll tell you what occurred next.
Next morning, the analyst said, “You’re amazing! And now, can we/you (meaning I) create a filter that hides all data except a specific date of interest? At this point, after briefly reveling in the ‘Amazing’ part, I got testy (think: nervous), saying “Well, if we filter out the older data, it will be gone, and we won’t have data underlying the 4 week moving average you requested.” The response was monumentally simple, “Uhhm, but I want to see the 4 week average. Can you do it, Mr. Tableau”? Since Mr. Tableau’s attempt at “platform-limitation as logic-limitation’ argument failed, all I could manage at the moment was “Okay, I’ll look into it.”
Googling madly, I luckily stumbled upon the Tableau term, ‘late filtering’. It sounded tasty — it was delicious — and it leads to the second effect of aforesaid dragging / dropping a table calc back to the metadata section and naming it. Most importantly, and although I neglected to capture a screenshot of the ‘late filtered’ solution we created, it works like this. In Tableau, a table calculation is limited to the worksheet wherein it was created, and thus has no effect on Tableau’s query on a data source, which happens to be good in this case. When a table that filters out older data is dragged to the metadata tab and named, then as I mentioned, it becomes part of workbook’s metadata, and thereby becomes part of the underlying query from Tableau to a data source. Think of it as an added WHERE clause on a SELECT statement. As such, if the query to the data source eliminated values prior to a given datetime, then of course, the underlying data for the 4 week moving average would be lost, right? Well, on the flip-side, if a table calc is NOT named (brought into metadata), it does NOT become part of the query, but instead is processed AFTER the data is brought onto a Tableau worksheet and is operated on as part of a calculation process (aka ‘late filtering’).
So, late filtering, as well as an appropriate viz, made up the secret sauce. All I had to do was remove the named Table Calc from the metadata and re-build it as a plain-old table calc. This made me laugh at myself, because notwithstanding my aforesaid failed ‘technology-limitation as logic-limitation’ impulse, I was able, with Tableau to support this unique request very elegantly and, here’s the funny part, with a very techno-platform-specific method!
Silly me! Anyway, did I get more ‘…you’re amazing!” praise? Nope, but I’ve learned not to expect it anyway. Was I pleased to deliver something cool and learn a new trick. You bet! All good.
